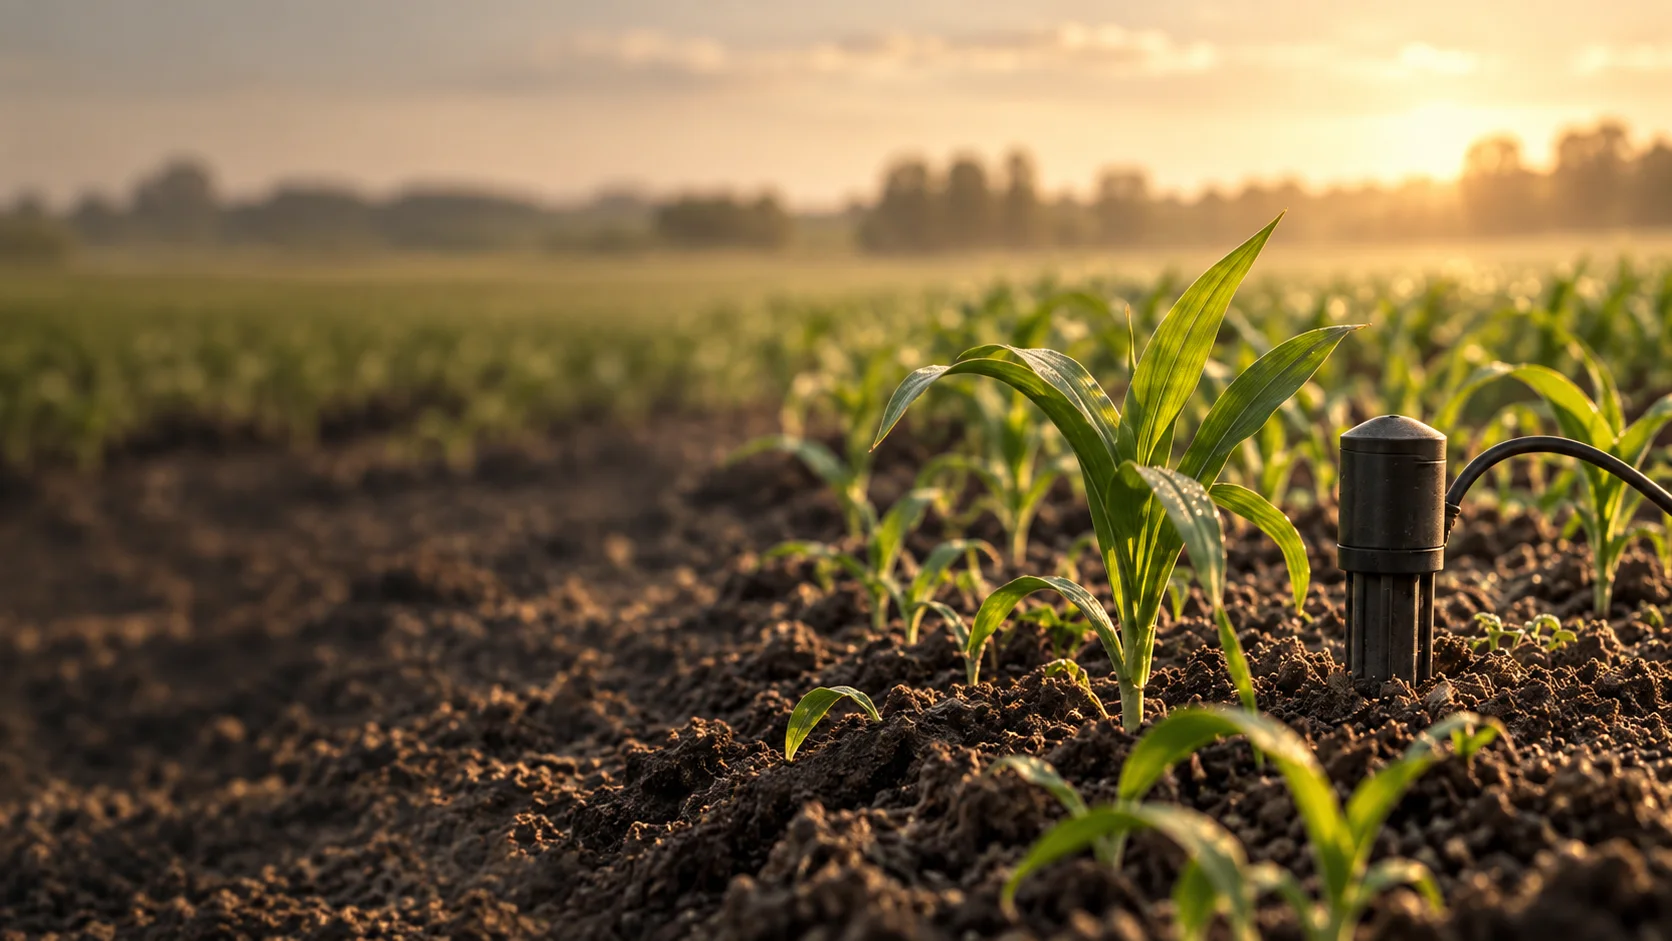
Field data. Ready for the next decision.
We build tools that bring field observations, sensor readings, and farm operations into one view. Track conditions, spot changes, and coordinate the work that follows.
Agronomy & field intelligenceRibhu Labs builds field dashboards that bring sensor readings, observations and farm tasks into one view for the people managing the land. It starts with a one-week Workflow Review of how field information reaches a decision today.
Start with
the real work.
Measurements, field notes, images, and work records often live in separate places. Comparing conditions takes effort, and the person planning the next task may not have the latest observation.
We organise records around the field, crop, date, and source, then connect the available data. Dashboards show changes over time; agreed rules flag conditions for review; shared tasks help the team respond. Data quality and local agronomic judgment remain part of the decision.
Follow the conditions.
Explore a simplified example. These demonstrations explain an approach; they are not connected to live systems.
From a reading
to a reason.
Continue observing.
The sample reading is above the illustrative 25% threshold. Record it and watch the trend.
A simplified rule for exploration. Real recommendations require crop, soil, sensor, and agronomist context.
What we
can deliver.
Scope is agreed around your systems, constraints, and intended outcome.
- 01
Field records that combine observations, images, and measurements
- 02
Sensor integrations and checks for missing, stale, or inconsistent data
- 03
Dashboards, trend views, and configurable review alerts
- 04
Task coordination and operating guidance for the farm team
From question
to capability.
- 01
Choose the field workflow
Identify the decision or task to support, the people involved, and how observations are collected today.
- 02
Connect and organise the data
Build a consistent record of fields, sources, units, and collection times. Make gaps and stale readings visible.
- 03
Build the working view
Test dashboards, alerts, and task flows with the people using them, then refine the rules for the setting.
A little more
clarity.
Can you connect our existing sensors?+
We assess the device interfaces, connectivity, available readings, and data quality. The integration can then be designed around the sources you have.
Does the tool replace agronomic expertise?+
No. It helps organise evidence and coordinate work. Crop-treatment decisions require appropriate local expertise and evidence for the specific conditions.
What information is useful to start?+
A description of the field workflow, examples of existing records, the sensors or tools in use, and the decision you want to support.
Workflow Review
We map one process with the people who do it, and mark where a rule, a model, or nothing at all belongs.
You get: A process map, a shortlist of changes and a clear go or no-go. Yours to keep, whoever builds it.
4 weeksPilot Build
One working piece built on your own data or task: tested with your team, documented, and handed over with training.
You get: A working system for one process, its source and documentation, and a team that can run it.
Half a dayTeam Workshop
A hands-on session using your own examples: where AI fits, how to map an automation, how to check a result.
You get: A shared vocabulary and two or three candidate processes worth reviewing.